ISS in Google Earth
International Space Station real-time in Google Earth
This post is about a thing I created for us in Google Earth. It shows the real-time location and future/past paths of travel for the ISS. I think it's pretty cool, but it's not the easiest thing to try out. I think it's worth it though.
If you don't care to read the full-post but have an interest in checking it out just go to the quickstart. One recommendation, download Google Earth on your laptop or desktop to try this out, bigger screen and it's easier to use. But mobile will work too, it'll just be a bit tricky.
Quickstart
- Download Google Earth.
- Visit this URL, and it will prompt you to download the
NetworkLink.kmlfile. - Save it to your device.
- Go to Google Earth and go to Projects.
- Go to Open or Create New Project.
- Select Import KML File
- Find the file from step #2 and select it. (Sorry if this is tricky on mobile)
- Now you'll have the ISS project loaded.
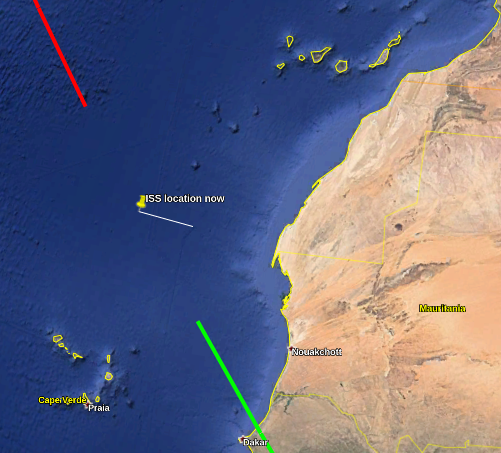
- Click on the ISS project and make sure it's visible by toggling the "eye" icon.
At the end of those steps you should be able to see something like this.
Background
I remember when Google Earth first came out and it was such a fascinating tech for me. I remember how mindblowing it was that all of the data had been acculumated and you were able to visualize to so many different levels of detail.
Google Earth actually had it's roots as a project called the Keyhole EarthViewer [1]. The reason I mention it is because I recently discovered that the primary way you can plot within Google Earth, even to this day, is by making use of the so-called "KML" files. KML stands for the "Keyhole Markup Language". It's essentially a domain-specific version of XML. In other words, it let's you program Google Earth to draw stuff [2].
Google Earth is a pretty remarkable piece of technology, and it's come a long way. There is also now the Google Earth Engine [3]. Which offers Javascript and Python APIs, for programming with datasets and creating maps to visualize those datasets. It's probably got a range of features I'm totally unaware of. It does feature an online code editor that reduces a barrier to entry.
But I didn't use Google Earth Engine for this project, I decided to go with the traditional Google Earth program, and hence my use of these KML files. I don't think that the type of of visualization I was interested in creating is suited for Google Earth Engine. It seems like that platform is more about very detailed 2-D maps, with data visualization. Whereas traditional Google Earth is 3-D and focused on 3-D surface modeling, and allowing you to manuever around. Would love to hear if I'm wrong about this.
How does it work?
So Google Earth on mobile or on desktop allows you to upload a KML file. There are actually a lot of features in the KML spec. It even includes support for including loading other KML files from a server. You can specify how frequently it should make requests to a given resource. This is what allows you to get data into Google Earth in "real-time".
The way I set this up is to have a single file called NetworkLink.kml.
This file can be loaded into Google Earth. Subsequently requests will be
made to the server specified below:
    <NetworkLink>
      ...
      <Link>
        <href>http://45.55.193.150:8080/iss-api/kml</href>
        <refreshMode>onInterval</refreshMode>
        <viewRefreshMode>onStop</viewRefreshMode>
        <refreshInterval>5</refreshInterval>
      </Link>
    </NetworkLink>
The above snippet means that google earth is going to poll that URL every 5 seconds to get fresh data. That's what enables the map to get updated in "real-time". The URL above just sends yet another KML file to Google Earth. The interesting parts of what gets sent are below:
- The current location of ISS, including the name of the city it's flying over. We will draw a point on the Google Earth map precisely where the ISS is located, including the height at which it's flying. And we will also draw a line from the surface of the earth to the ISS (extrude). Here's an example from when it was over Quebec:
  <Placemark>
    <name>ISS location now</name>
    <description>Minganie, Côte-Nord, Québec, Canada</description>
    <LookAt>
      <longitude>-63.5041232433411</longitude>
      <latitude>48.90289368028179</latitude>
    </LookAt>
    <Point>
      <extrude>1</extrude>
      <altitudeMode>absolute</altitudeMode>
      <coordinates>-63.5041232433411,48.90289368028179,424332.3821336621</coordinates>
    </Point>
  </Placemark>
- The past flight path. The
LineStringfeature can be used to draw a line that connects many different points:
  <Placemark>
    <name>Past flight path</name>
    <styleUrl>past-style</styleUrl>
    <LineString>
    <extrude>0</extrude>
    <tessellate>1</tessellate>
    <altitudeMode>absolute</altitudeMode>
    <coordinates>
      -68.925310836895,50.07804605627934,424600.4165427953
      -74.59464384641467,50.96368016088214,424801.52212330536
      ...
      108.00937065259644,-51.720695753340884,436338.6855591794
    </coordinates>
    </LineString>
  </Placemark>
- We can do the same thing for the future flight path:
  <Placemark>
    <name>Future flight path</name>
    <styleUrl>future-style</styleUrl>
    <LineString>
    <extrude>0</extrude>
    <tessellate>1</tessellate>
    <altitudeMode>absolute</altitudeMode>
    <coordinates>
      -58.369719927889186,47.46228136272517,424003.5761499372
      -53.544354992249644,45.782961553138136,423621.7565849002
      ...
      121.43846724393838,-42.805571420433665,432743.81270783197
    </coordinates>
    </LineString>
  </Placemark>